By Ron Schack, Ph.D., The Charter Oak Group, LLC
In 2014, The Hartford Opportunity Youth Collaborative began developing a Results-Based Accountability framework to guide and assess their work. HOYC identified a set of quality of life indicators for youth, which serve to measure the extent to which the community is achieving desired quality of life results, such as educational success, employment, and self- sufficiency.
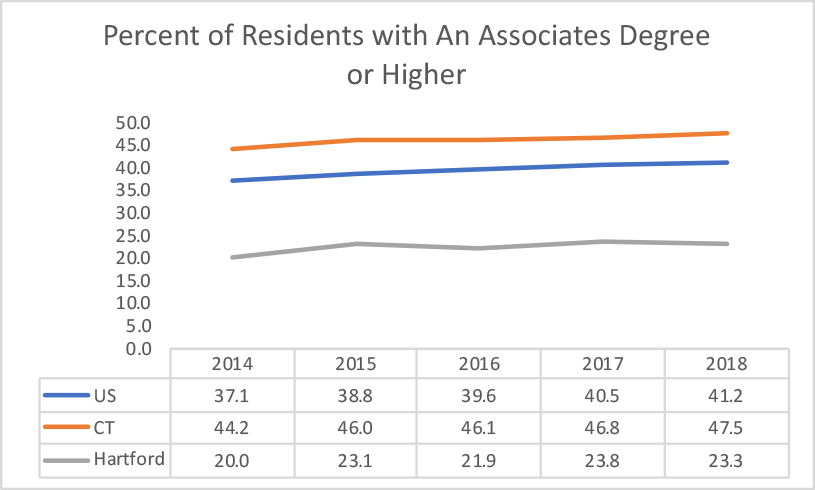
Educational Success
The primary indicator of educational success is the percentage of Hartford residents with at least an Associate’s degree. While the data show a generally improving trend at the national, state, and local level, Hartford’s rate is almost less than half the rate in CT overall.
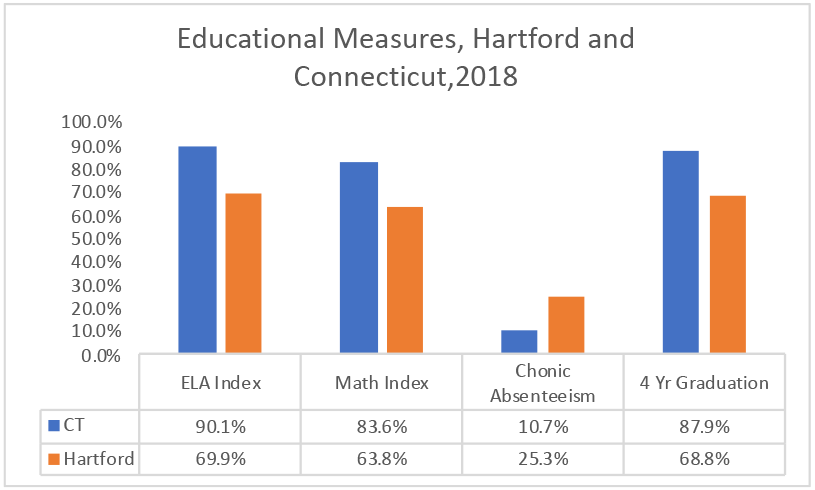
There are several additional measures of educational success that are worth examining, including the rate of chronic absenteeism, the English and Language Arts Performance index score, the Math performance index score, and the 4-year graduation rate. In all cases, Hartford is considerably lower than the overall state average. These educational challenges are clearly precursors to difficulties with achieving another important result, employment.
Employment
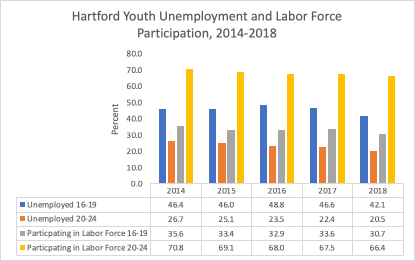
While there is a downward trend in unemployment at the national, state and local level, a closer look reveals some disturbing disparities. The unemployment rate for youth 16-19 was at 41.1% in 2018, while the rate for young adults 20-24 was 20.5%. This is much higher than the overall unemployment rate for the city, and substantially higher than the rate for 16-19 year olds (18.5%) and 20-24 year olds (10.5%) nationally. Keep in mind that these unemployment rates are for those looking for employment. Labor force participation stands at 30.7 percent for 16-20 year olds, and 66.4% for 21-24 year olds, compared with national rates of 38.9% and 74.6% nationally. Continued high rates of unemployment for youth lead to difficulties in earning enough income to achieve self-sufficiency, another important desired quality of life result.
Self-Sufficiency
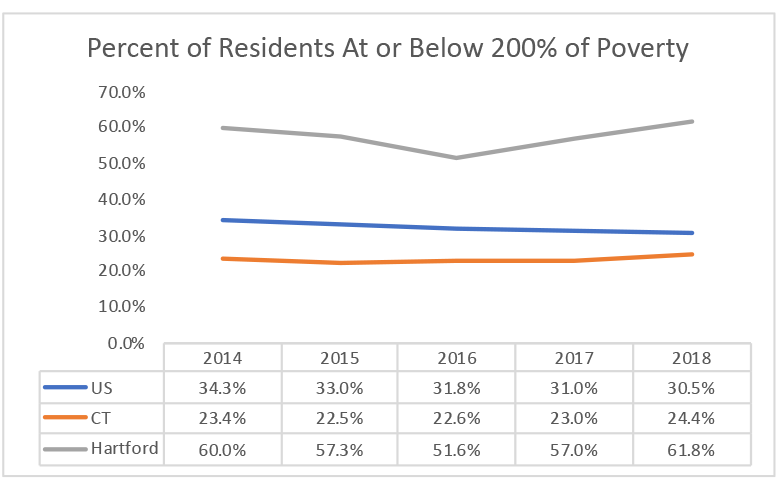
The following chart shows the percent of residents earning at or below 200% of the poverty level, which has long been used as a proxy for self-sufficiency (although many argue this threshold is too long, and that 300 or even 500 percent of poverty should be used). Even so, the percentage of Hartford residents earning at or below 200% of poverty is 61.8%, more than double the average rate in US and even worse in comparison with the average rate in Connecticut. This trend is worsening in CT and Hartford, while improving slightly in the US overall.
Disconnected Youth
Youth not working or succeeding in school (and eventually not participating in school at all) is a clear driver of the above gaps in educational success, employment, and self-sufficiency. The Hartford Opportunity Youth Collaborative has focused on engagement of opportunity youth—those youth that are unemployed and not in school. While the number of disconnected youth in Hartford has declined slightly, there are still over 4000 disconnected youth that need to be re-engaged.[LD4]
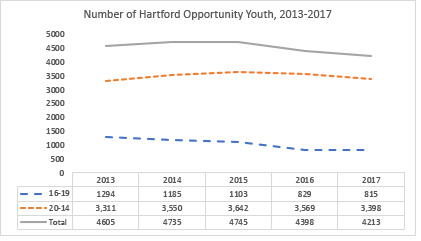
Source: ACS PUMS 5-Year Data, 2009-2013 through 2013-2017
The Aspen Institute has recently developed a set of Equity Measures for Opportunity Youth.[1] These measures can help us understand different “dimensions of disengagement” and help us to develop strategies to reduce disconnection and help youth achieve these important quality of life results.
The following chart shows a comparison of the Hartford region (Hartford and surrounding towns)[2] with all 26 Aspen Opportunity Youth sites for which data were compiled. Four measures are presented: Community Disconnection Rate, High School Disconnection Rate, Post-Secondary Disconnection Rate, and Workforce Disconnection Rate. The data come from the 2017 American Community Survey Public Use Microdata (PUMS).
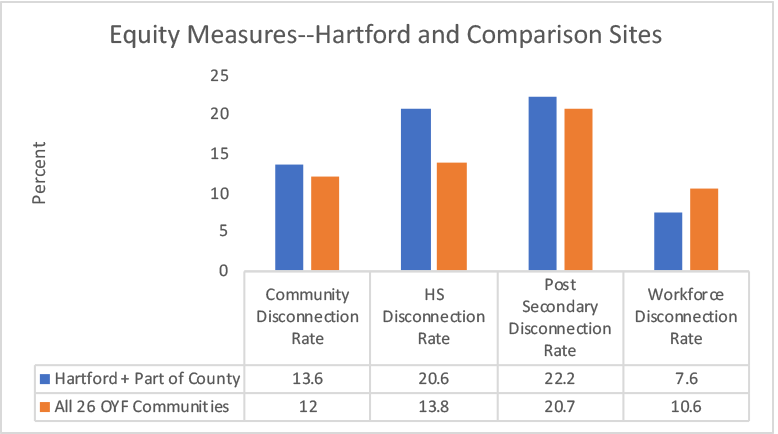
The first rate, the Community Disconnection Rate, shows the number of young people not in school and not working, as a percentage of the number of 16-24 year olds in the community. Hartford is just slightly above the average of all sites on this measure. Of the 69,483 youth 16-24 youth included in denominator of the Hartford area measure, 9,456 were not in school or not working. That is a significant number of youth that need help becoming re-engaged. The disconnection rate for Hartford Black youth is slightly higher, at 15.1%, and significantly higher for Hartford Hispanic youth, at 25.1%. This is considerably higher than the average rate for Hispanics across all included communities. The disconnection rate is also significantly higher for males, at 18.5%.
The second rate, the High School Disconnection Rate, shows the number of young people not enrolled in high school as a percent of 16-24 year olds without a high school diploma or GED and not working. Hartford is considerably higher (20.6% vs 13.8%) than the average of all sites on this measure. Again the High School Disconnection rate for Hartford Hispanic youth is extremely high, at 43.6%. Unfortunately, the rate for Blacks is not available for this measure, due to limitations with the ACS sample. The high school disconnection rate is also significantly higher for males, at 31.6%. This is much higher than the average rate for males across all the sites, at only 15.4%.
The Post-Secondary Disconnection Rate shows the number of young people not enrolled in a post-secondary institution as a percent of 16-24 year olds with a HS diploma or GED who do not have a post-secondary credential and are not working, plus those that with a HS diploma or GED that do not have a post-secondary credential that are working. Hartford is slightly higher than the average of all sites on this measure. In Hartford, Hispanics have significantly higher rates on this as well (42.2%) while males have somewhat higher rates (at 27.6%). Unfortunately, the rate for Blacks is not available for this measure, due to limitations with the ACS sample. In Hartford, those who earn less than 200% of the poverty level also have a significantly higher rate of disconnection on this measure (49.6%, compared with 11% for those who earn more, and compared with 28.5% for those who earn less than 200% of poverty across all communities).
The Workforce Disconnection Rate shows the number of young people not working as a percentage of the number of 16-24 year olds with a PS credential, but not enrolled in a PS institution. Hartford is considerably lower than the average of all sites on this measure.
No further demographic breakouts are available for this measure due to limitation with the ACS sample.
A Progressive, Interconnected Set of Challenges
These
data show a set of interrelated challenges that start with difficulties in
achieving academic success, leading to youth disengagement (particularly for
Blacks, Hispanic, and male youth). This
disengagement leads to difficulties in finding employment, and continued
challenges with further post-secondary preparation. Ultimately, this is reflective in lower
rates of Post-secondary educational
attainment, and lower rates of self-sufficiency. We need to ensure that we
develop and enhance strategies to intervene early with youth struggling
academically, to keep youth attending and engaged in school, to support those
no longer likely to return to school, and to create viable paths to
post-secondary education, employment, and self-sufficiency.
[1] Equity Counts: Tracking Opportunity Youth Outcomes. Equal Measure, September 2019.
[2] This was done to allow for important disaggregations of the data: Harford PUMS data alone was not sufficient for many of the demographic break-outs by measure; even with the other towns included there were still some omitted due to small cell size. But, the addition of these towns is likely to underestimate the disparities identified in the above analysis.